Task Safety Time

Task Safety Time
How do you estimate task durations in the face of uncertainty?
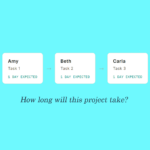
This picture illustrates why any realistic duration estimate will include safety time.
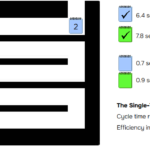
Task X needs somewhere between 3 and 10 or more days of focused work. Move the red slider to set a planned duration. In the black box above the graph, you’ll see the planned duration from the slider, the days of safety included in the duration, and the resulting probability of completing the task in the time estimated.
Factor in other things going on by changing the % time you actually spend on project tasks (versus meetings, email, etc.) and by increasing the number of tasks to be worked on simultaneously.
Planned Duration:
–
Slider position
Days Safety:
–
Slider minus X’s minimum duration
Probability of Completion:
–
Chance X is done by the planned day
Probability of completing X by day
Durations stretched ×1Duration (days)
Share of the worker’s time spent on project tasks (1–100)
%
Tasks being worked at once, including X (1–4)
tasks
How the curve is built
Task X follows a PERT‑beta distribution with a minimum of 3 days, a most likely duration of 5 days and a 90% point of 10 days. Solving for those three points gives a maximum of about 17 days and a mean of about 6.7 days, which produces the long right tail.
All durations are multiplied by (tasks in process) ÷ (% time on projects). Two tasks at 100% doubles everything; one task at 50% also doubles everything.
Days Safety is measured from X’s minimum duration at the current settings (the green dashed line), so it shows how much room the planned duration leaves beyond the fastest possible finish.